You may be familiar with machine monitoring systems such as JD Link or RemoteLog, introduced by John Deere and Tigercat, respectively. These systems offer machine owners the opportunity to monitor details of individual machines, including utilisation, location, and performance. Now, imagine a system that captures data from every machine on site, regardless of the brand, and consolidates it in one place, in real time. Such an innovative system would not only track each machine’s operational status, location, productivity, and fuel efficiency but could also monitor the wear on machine parts. Well, wait no longer – we’re almost there!
Patrick Humphrey, a recent graduate of the Forest Engineering programme at the School of Forestry, University of Canterbury, is one year into his PhD, working on developing this system. All modern harvesting equipment has electronic controls routed through a Controller Area Network (CAN Bus). This encompasses all operator inputs from the operation, as well as all the signals that control the movements and functions, plus engine parameters (such as RPM, temperatures, etc.), and diagnostics (such as fault codes and warnings). The CAN data is collected and stored on the data logger and, if connected via an onsite Wi-Fi signal, data is uploaded to the internet to be analysed and displayed in real-time.
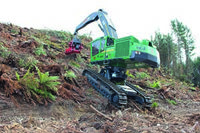
After the system was designed, Mr Humphrey (supervised by Dr Campbell Harvey) collaborated with Simon and Adam Brand (of Brand Logging, Canterbury) to test the system by implementing it on their John Deere 959 MH felling machine. Data was captured over a total of 224 days from two different forests: Chaney’s Forest (from 10th July to 5th October) and Ashley Forest (from 9th October to 19th February). A total of 104 different machine and GPS metrics were collected, including engine speed, position, engine fuel rate and pitch/roll angles. These variables were then analysed and ultimately presented in an interactive dashboard.
Deeper understanding
By using this system and analysing data from two different sites, many interesting findings and comparisons between the two sites were possible. For example, there was a noticeable difference in utilisation, which is the amount of time the machine was working compared to the total time it was on. Engine speed was categorised into ‘Operating’, ‘Idling’, ‘Idling Up or Down’, and ‘Off’, based on RPM ranges. In Chaney’s Forest, the felling machine was found to operate 76% of the time, compared to 80% in Ashley Forest. Examining the foot pedal data, more time was spent moving/tracking in Chaney’s Forest with 59%, with slightly less in Ashely Forest at 55%. This type of detail could help contractors understand how different forest areas affect operational effectiveness and to introduce data driven decisions into their planning for future harvest areas, says Mr Humphrey.
Understanding the terrain of the forest is also feasible using the machine data; for instance, by using the roll (side tilt) and pitch (forward and back tilt) angles of the machine. A comparison of the two forests found that time spent at higher roll and pitch angles was...